All products
PROBE-MCP

Ask Claude what's happening on your network

A probe container runs on a Linux host inside your LAN. Claude reads summaries from the engine and pulls live syslog, SNMP and inventory detail through the probe when a question needs it.

Claude
Which switches logged errors in the last hour, and is any of it new?
PROBE-MCP Searched the last hour of syslog. Two switches logged errors: SW-Core-1 shows repeated PoE overload on port 14, and SW-Floor3 has a new message type the probe hasn't seen before, a spanning-tree topology change. Want the raw lines?
Illustrative example
43
probe functions for Claude
7 days
syslog stored on probe
90 days
scorecard PDF share link

Up in three steps

Sign in and enroll a probe

Sign in with Google at probe-mcp.lanpulse.com, name your site, and get a one-line Docker command. The activation code is single-use and expires in one hour.

Run the container on a LAN host

The host needs Docker and outbound internet on 443. No inbound ports or forwarding needed. Point devices at the probe: syslog 514, SNMP traps 162, polls go out on 161.

Connect Claude and ask

Copy the connector URL from your dashboard into Claude's Settings → Connectors and approve the sign-in. Two guided workflows are ready in Claude's menu.

What stays on your LAN, and what leaves it

What crosses your network boundary Switches, access points and firewalls send syslog, SNMP traps and flow data to a probe container on your LAN, and the probe polls them over SNMP. The probe keeps full logs for 7 days, flow records and a packet ring buffer. It connects out to the PROBE-MCP engine on Cloudflare over a signed outbound tunnel and sends four kinds of data, numbered in the legend. Claude talks only to the engine. YOUR LAN Switches · APs · firewalls any vendor syslog · traps flow SNMP polls Probe container on your host · stores: Full logs, 7 days Flow records Packet ring buffer 1 2 3 4 outbound only PROBE-MCP engine on Cloudflare Summaries and device inventory Sandboxed script 43 probe functions Claude connector
What crosses the boundary between your LAN and the cloud:
  1. Summaries: log volume, SNMP device health, top talkers from flow data, and your device inventory. Stored in the cloud.
  2. Error-level and vendor-matched log lines, and SNMP traps, as raw lines. Passed to a linked R1-MCP if you set that up, otherwise dropped. Not stored.
  3. Live queries from Claude and their results, only when a question needs detail from the probe. Not stored.
  4. Packet-capture slices and SSH session recordings, when you ask for them. Stored in the cloud.

Everything travels over a signed, outbound-only tunnel. The probe opens no inbound ports.

What you can ask Claude

Claude reaches into the probe for live detail or reads stored summaries when the probe is offline. Syslog, SNMP, traps and device discovery are on by default.

Syslog search and triage

Query and full-text search 7 days of logs and SNMP traps. Vendor parsing for Cisco IOS, MikroTik, pfSense and RUCKUS. Unmatched lines cluster so new message types surface.

SNMP health and inventory

CPU, memory and bandwidth per device from live SNMP polls. Device inventory with vendor, type and role from mDNS, SSDP and LLDP classification.

Port and PoE diagnostics

Per-port status, speed, errors and discards on switches. PoE budget and faulted ports. Ask which ports are down or running at reduced speed.

802.1X and DHCP timelines

Per-client auth history with a one-word outcome and the reject reason, decoded from mirrored traffic. Needs packet capture enabled. Covers 802.1X, RADIUS and DHCP events.

Inventory reconciliation

Compare your cloud controller's device list against the probe's live view. Flag devices the controller says are offline that are still alive on the wire.

Assessment Scorecard PDF

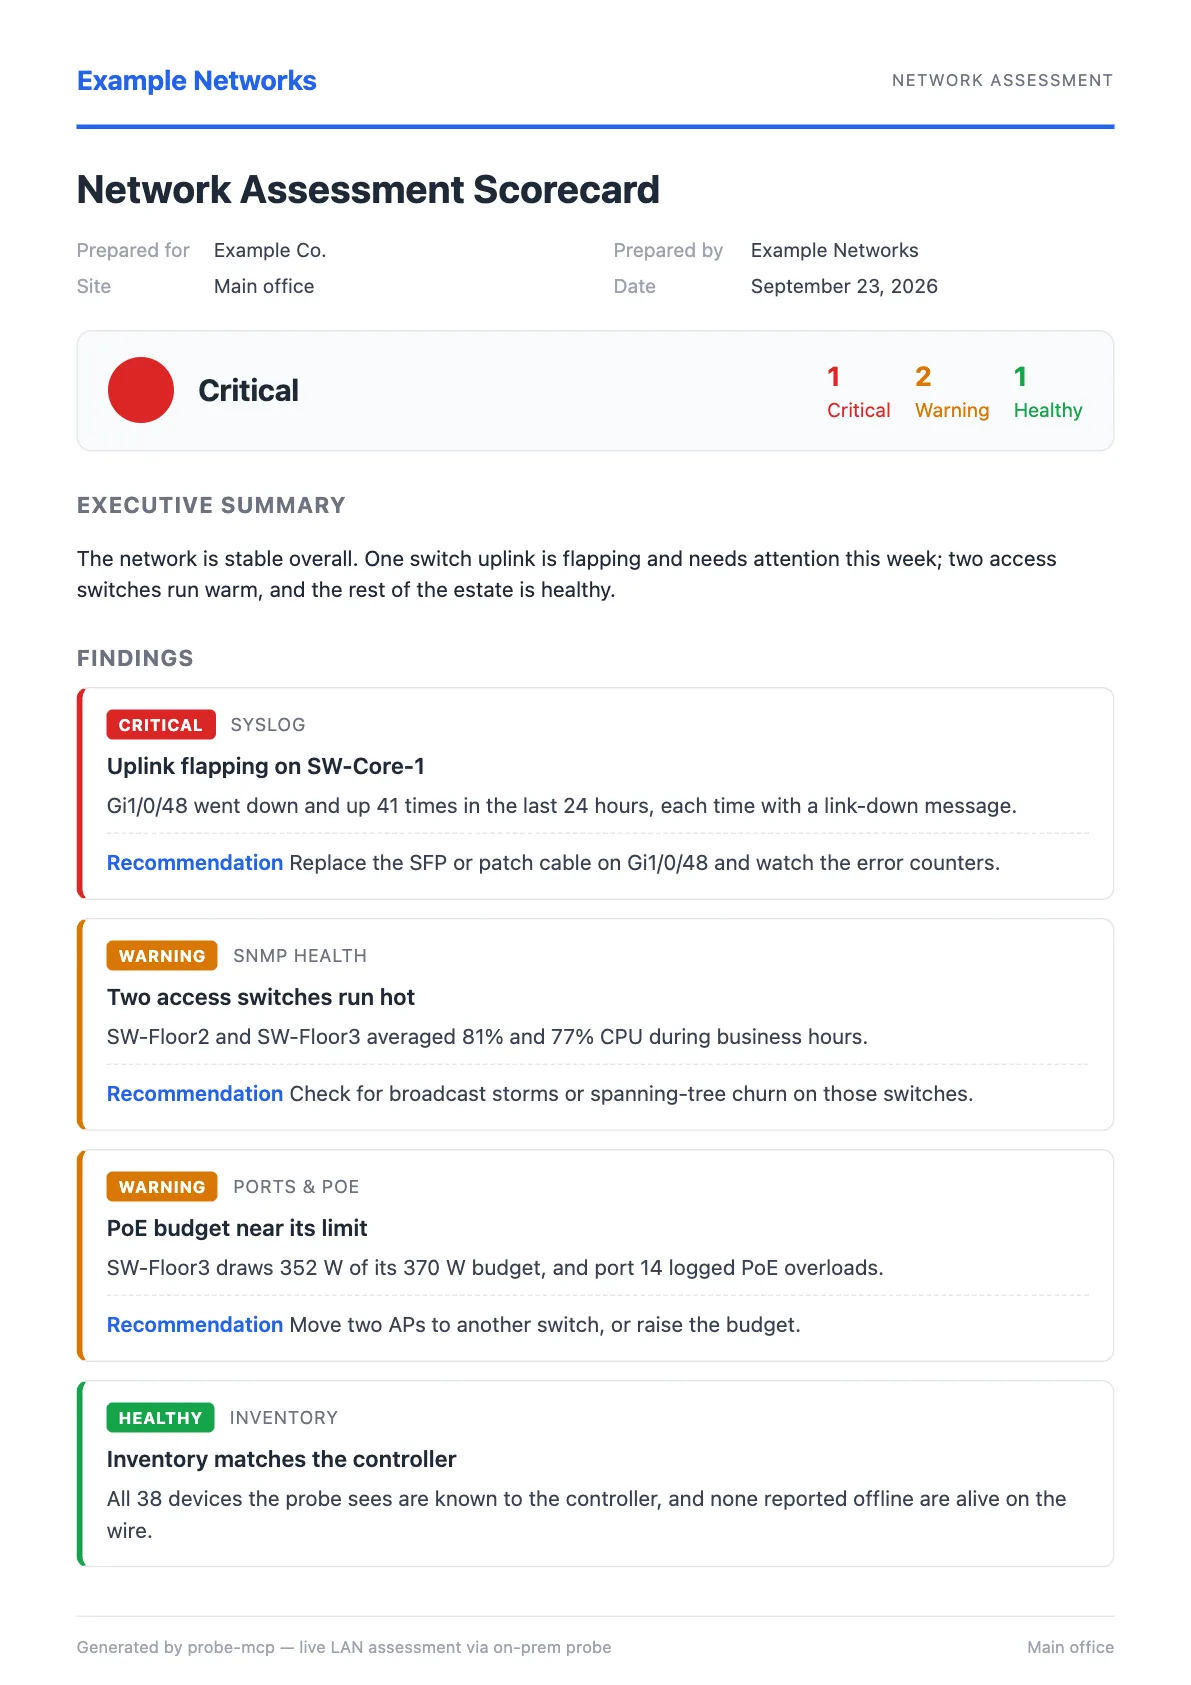
Claude ranks findings red, yellow and green from real syslog, SNMP and inventory data, then renders a co-branded PDF with a 90-day shareable link.

Flow, capture and CLI

When enabled: query flow records by IP, port and protocol; capture packets from a mirror port; run CLI on switches and APs. All three are off by default.

The PROBE-MCP Probes page: the connector URL to add to Claude, and two online probes with events per minute, device count, LAN IP and the ports to point collectors at. Example values.
Probe status, events per minute and the Claude connector URL
Page one of a Network Assessment Scorecard PDF from PROBE-MCP: an overall Critical grade with counts, an executive summary, and findings ranked Critical, Warning and Healthy, each with a recommendation. Example content.
Red, yellow and green findings with a 90-day share link

Who uses PROBE-MCP

Network admin

Triage syslog errors, check SNMP health and trace auth failures on a live site without logging into five separate tools or writing a query.

MSP engineer

Enroll a probe per customer site. Each site is scoped to your Google account. Ask Claude about any of them by name.

PS and pre-sales engineer

Run a Network Assessment Scorecard and hand the customer a co-branded PDF with findings ranked red, yellow and green from real data collected on-site.

Security reviewer

Read the data path section below. The probe opens no inbound ports. Opt-in capabilities are off until you edit the probe config on the host.

Data path and access controls

Full logs and packet data stay on a probe you run. Claude gets summaries, and live detail on request.

What stays on your probe

Full syslog store (7 days or 1 GiB), flow records (24 h), individual flow detail (6 h) and the packet ring buffer (1 GiB) stay on the probe host.

What the engine stores

Log-volume rollups, SNMP health summaries, top-talker aggregates and device inventory. Error-level and vendor-matched syslog lines and SNMP traps are sent as they happen, passed to a linked R1-MCP if you set that up, and not stored.

What goes to the cloud on request

Packet capture slices (.pcap, up to 50,000 packets) when Claude calls a capture query; SSH session recordings when a session ends. Download links expire; objects remain until account deletion.

The probe opens no inbound ports

The probe needs outbound internet on 443. Its local API binds to 127.0.0.1 only. Probe requests are HMAC-signed both ways; the tunnel hostname alone is not enough.

Not read-only by design

Syslog, SNMP and diagnostic functions read. Device CLI and controller calls are off by default and must be turned on at the probe. API connection egress is available by default. All are bounded by the credentials you provide.

How it's built

A one-person project from first spec to live service in about eleven weeks.

Starting with specs

The first commit on 2026-07-05 was the full PRD, architecture doc and data-flow spec — no code. Writing the spec before the code forced me to answer the hard questions first, especially: where does each piece of data actually live, and what happens when the probe goes offline?

The probe chassis — activation, the outbound Cloudflare tunnel, the HMAC-signed uplink, and the write-ahead log that buffers telemetry during outages — was forked from an earlier probe codebase I wrote. That's why the collectors landed on day one. The real design work was on the cloud side.

The storage split

The central question was where data lives. Shipping all logs to the cloud would be simpler, but it would undermine the reason to run a local probe. Shipping nothing would make Claude useless the moment the probe went offline.

The answer: cheap summaries flow continuously to the engine so questions about last week still work when the probe is down. High-volume raw data stays on the probe and is fetched through the tunnel only when a specific question needs it. Every live function returns a clean offline result instead of an error, so Claude can fall back to what the engine already knows.

One surface, 43 functions

Claude has one MCP tool that runs a short script in an isolated V8 sandbox. The sandbox exposes 43 typed functions covering syslog search, SNMP, flow, topology, capture, CLI and more. Claude can compose across them in a single call — query logs, check inventory, reconcile the controller — instead of choosing among dozens of separate tools.

The sandbox has a 30-second wall-clock cap and a 20,000-character output limit. I wrote 75 Go test files and 32 TypeScript test files to keep the system honest, and CI runs the full suite with the race detector on every change.

Common questions

Yes. The probe collects standard syslog, SNMP and sFlow from anything that sends them. Vendor-specific parsing packs cover Cisco IOS, MikroTik, pfSense and RUCKUS; other gear feeds through generic extractors.
Log-volume rollups, SNMP health summaries, top-talker aggregates and device inventory go up continuously. Error-level and vendor-matched syslog lines and SNMP traps are sent as they happen but are not stored there. Pcap slices and SSH recordings are stored in the cloud when requested. Full logs, flow detail and the packet buffer stay on your probe.
Syslog, SNMP and diagnostic functions read. Device CLI and controller calls can make changes, but both are off by default and must be turned on at the probe. API connection egress is available by default. All are bounded by the credentials you provide.
A Linux host (amd64 or arm64) running Docker with outbound internet on 443. No inbound firewall rules, no VPN, no port-forwarding. On the LAN, point your devices at the probe for syslog (514) and SNMP traps (162).
No. Syslog collection, SNMP polling, SNMP traps and device discovery are on by default. Flow, packet capture, SSH CLI and controller reach-through are off and must be enabled by editing the probe's config on the host.
Yes. Link your PROBE-MCP account to R1-MCP on a consent page and a linked R1-MCP can call 36 of the 43 probe functions, including SSH CLI and controller reach-through. The link requires explicit consent and can be removed.
Free to use today. Sign up with any Google account that has a verified email. No billing code, no invite list.

Start in minutes

Sign in with Google, run a one-line Docker command, and ask Claude about your network.

Try PROBE-MCP free ↗

PROBE-MCP is a product of NeuralConfig LLC. Claude is a trademark of Anthropic.