All products
Dashboard Gallery

Find the dashboard. Import it today.

21 ready-to-import RUCKUS One and RUCKUS AI (SmartZone) dashboards, searchable in plain English. Describe what you need, see what fits, or request one.

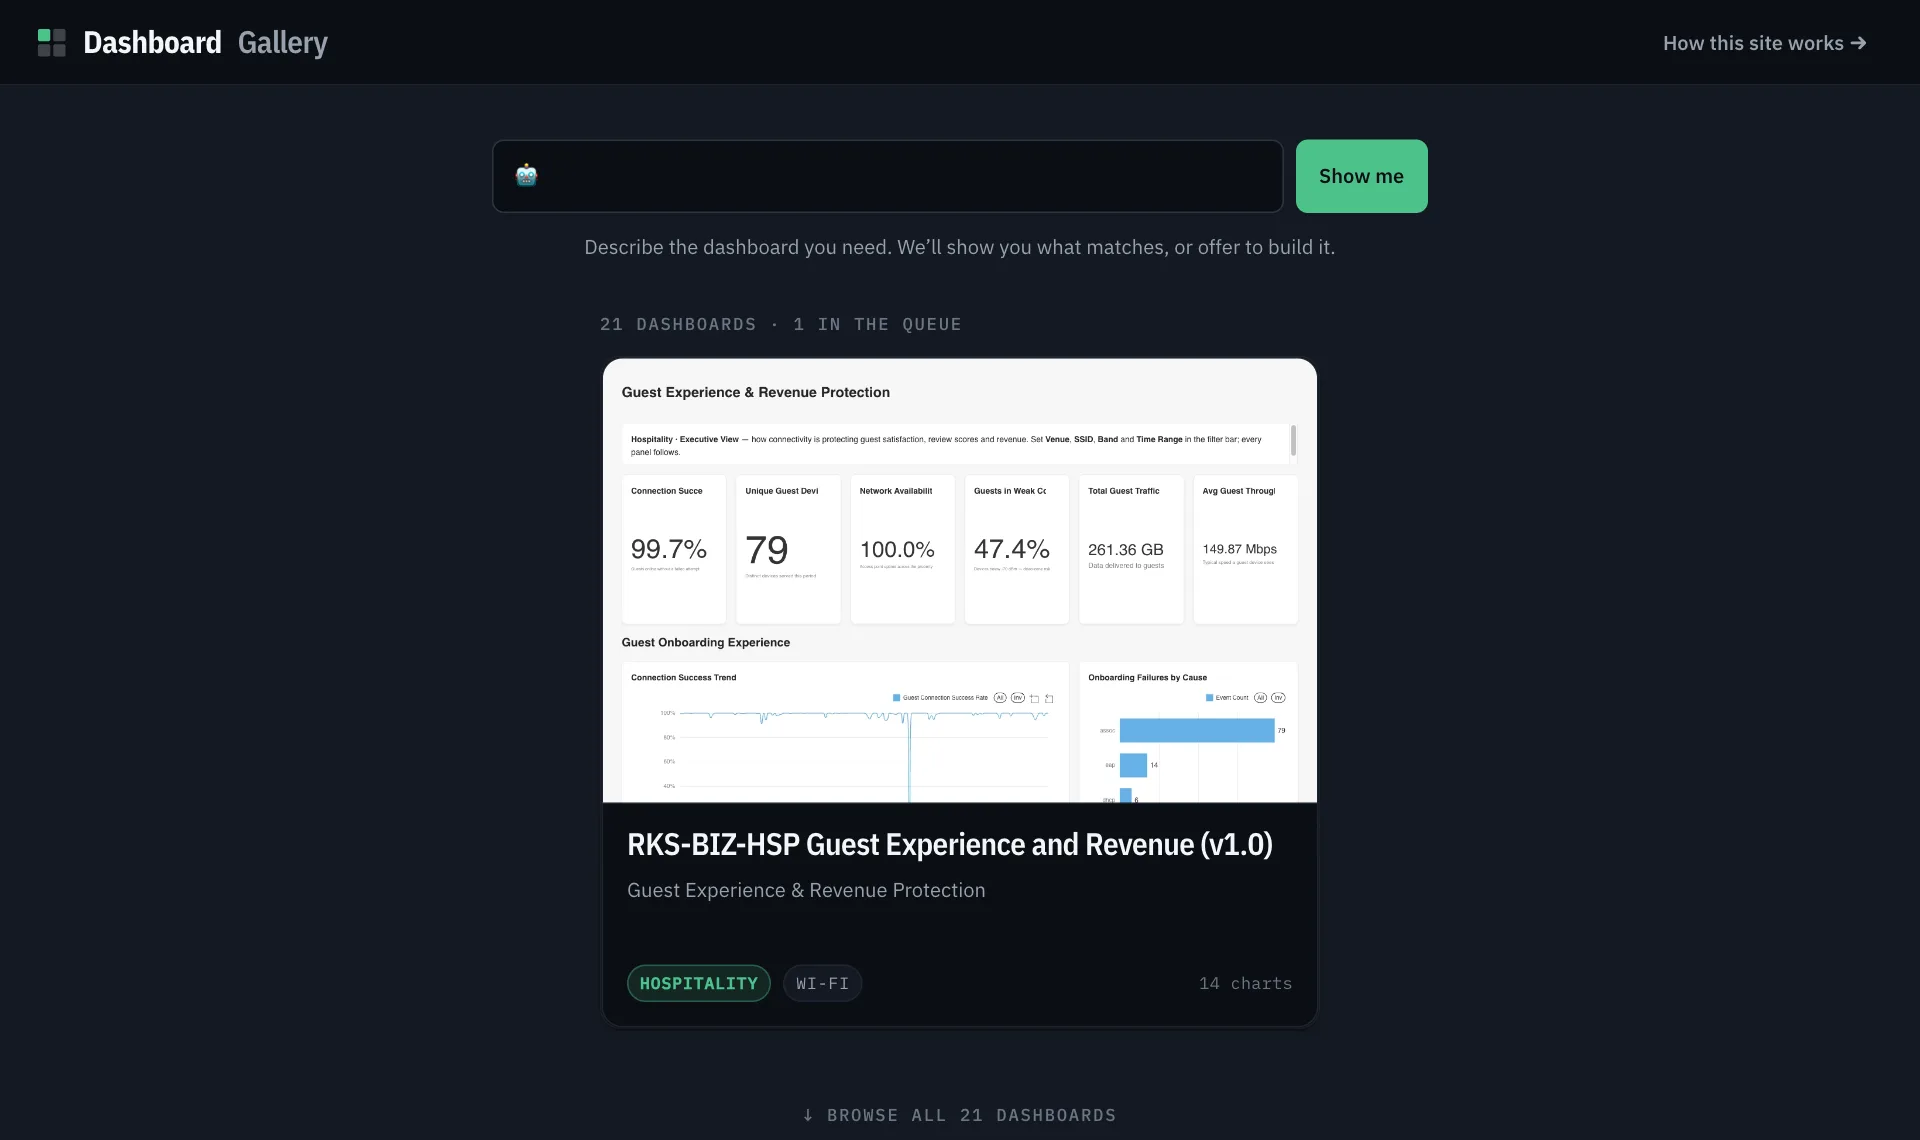
The Dashboard Gallery landing page: a search box with a Show me button, the line 21 dashboards and 1 in the queue, and an example question above the dashboard it finds.
21
published dashboards
304
charts across them
9
verticals covered

How the gallery works

From the first question to an imported dashboard — and what to do when the right one isn't there yet.

  1. Step 1

    Describe the problem

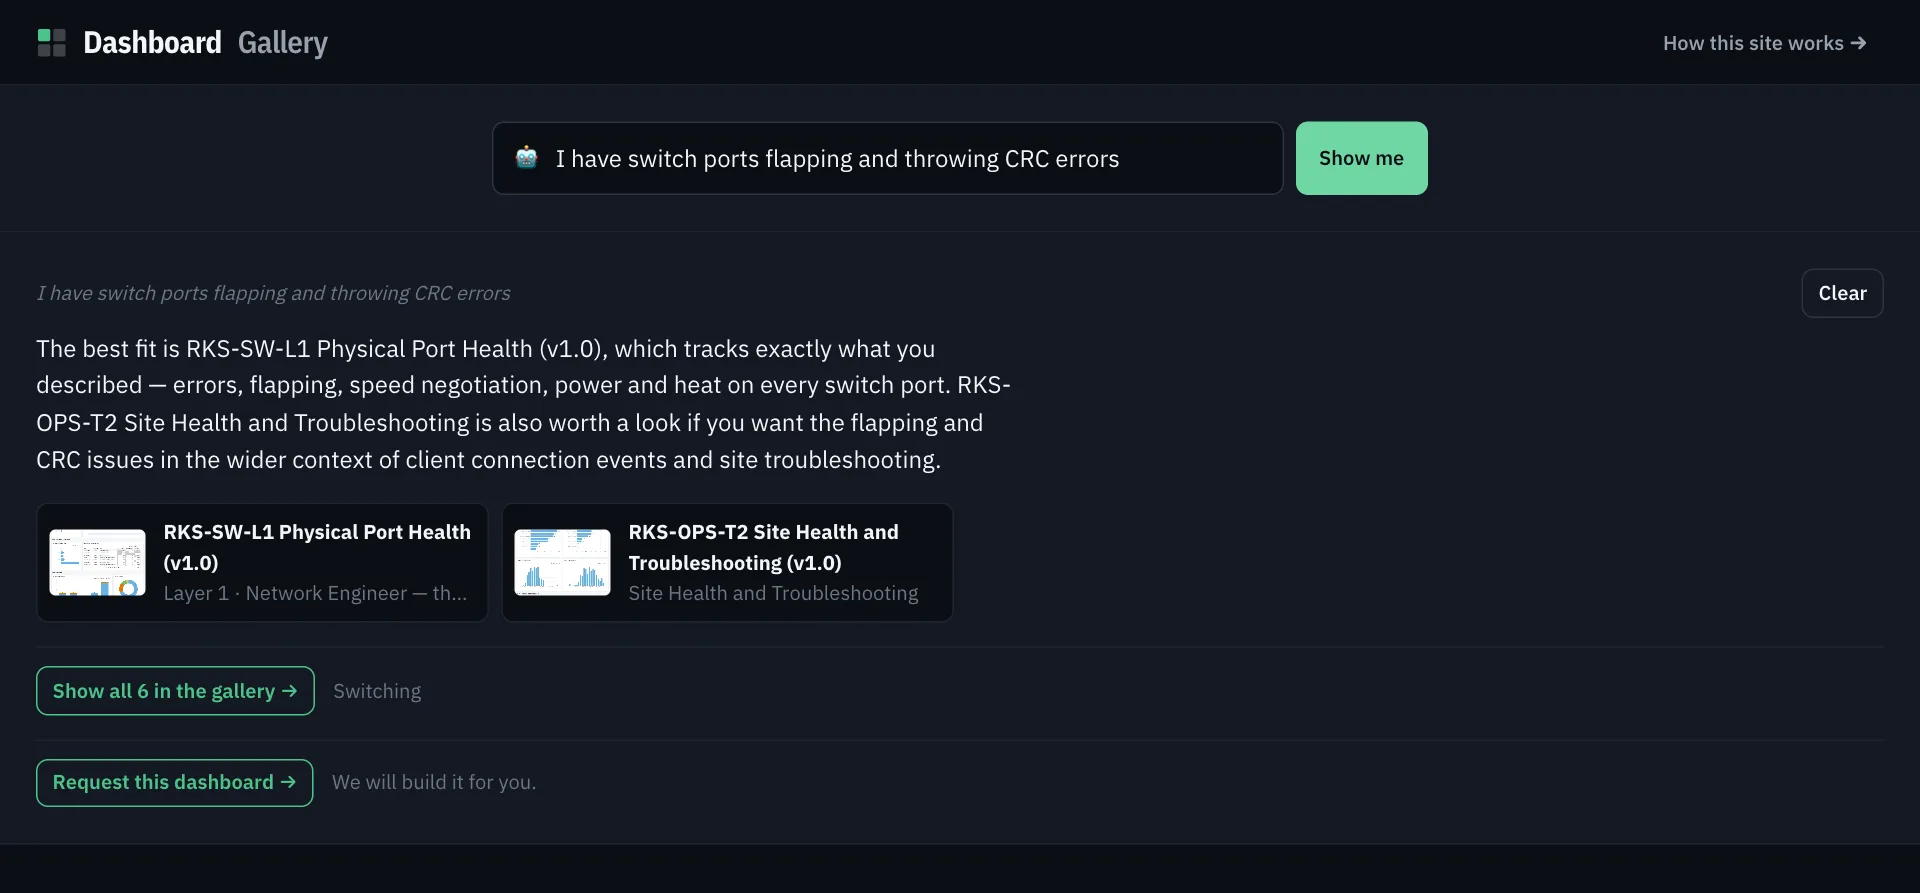
    Type “I have switch ports flapping and throwing CRC errors” and press Show me. The search names RKS-SW-L1 Physical Port Health as the best fit, RKS-OPS-T2 Site Health and Troubleshooting as a second, and offers Show all 6 in the gallery → for Switching. Below every answer, Request this dashboard → offers to have one built.

    Click the field after an answer to clear it and ask something new.

    A search answer for switch ports flapping and throwing CRC errors: two sentences naming the best fit and a second option, two dashboard cards, Show all 6 in the gallery, and Request this dashboard.
  2. Step 2

    Filter by role or product

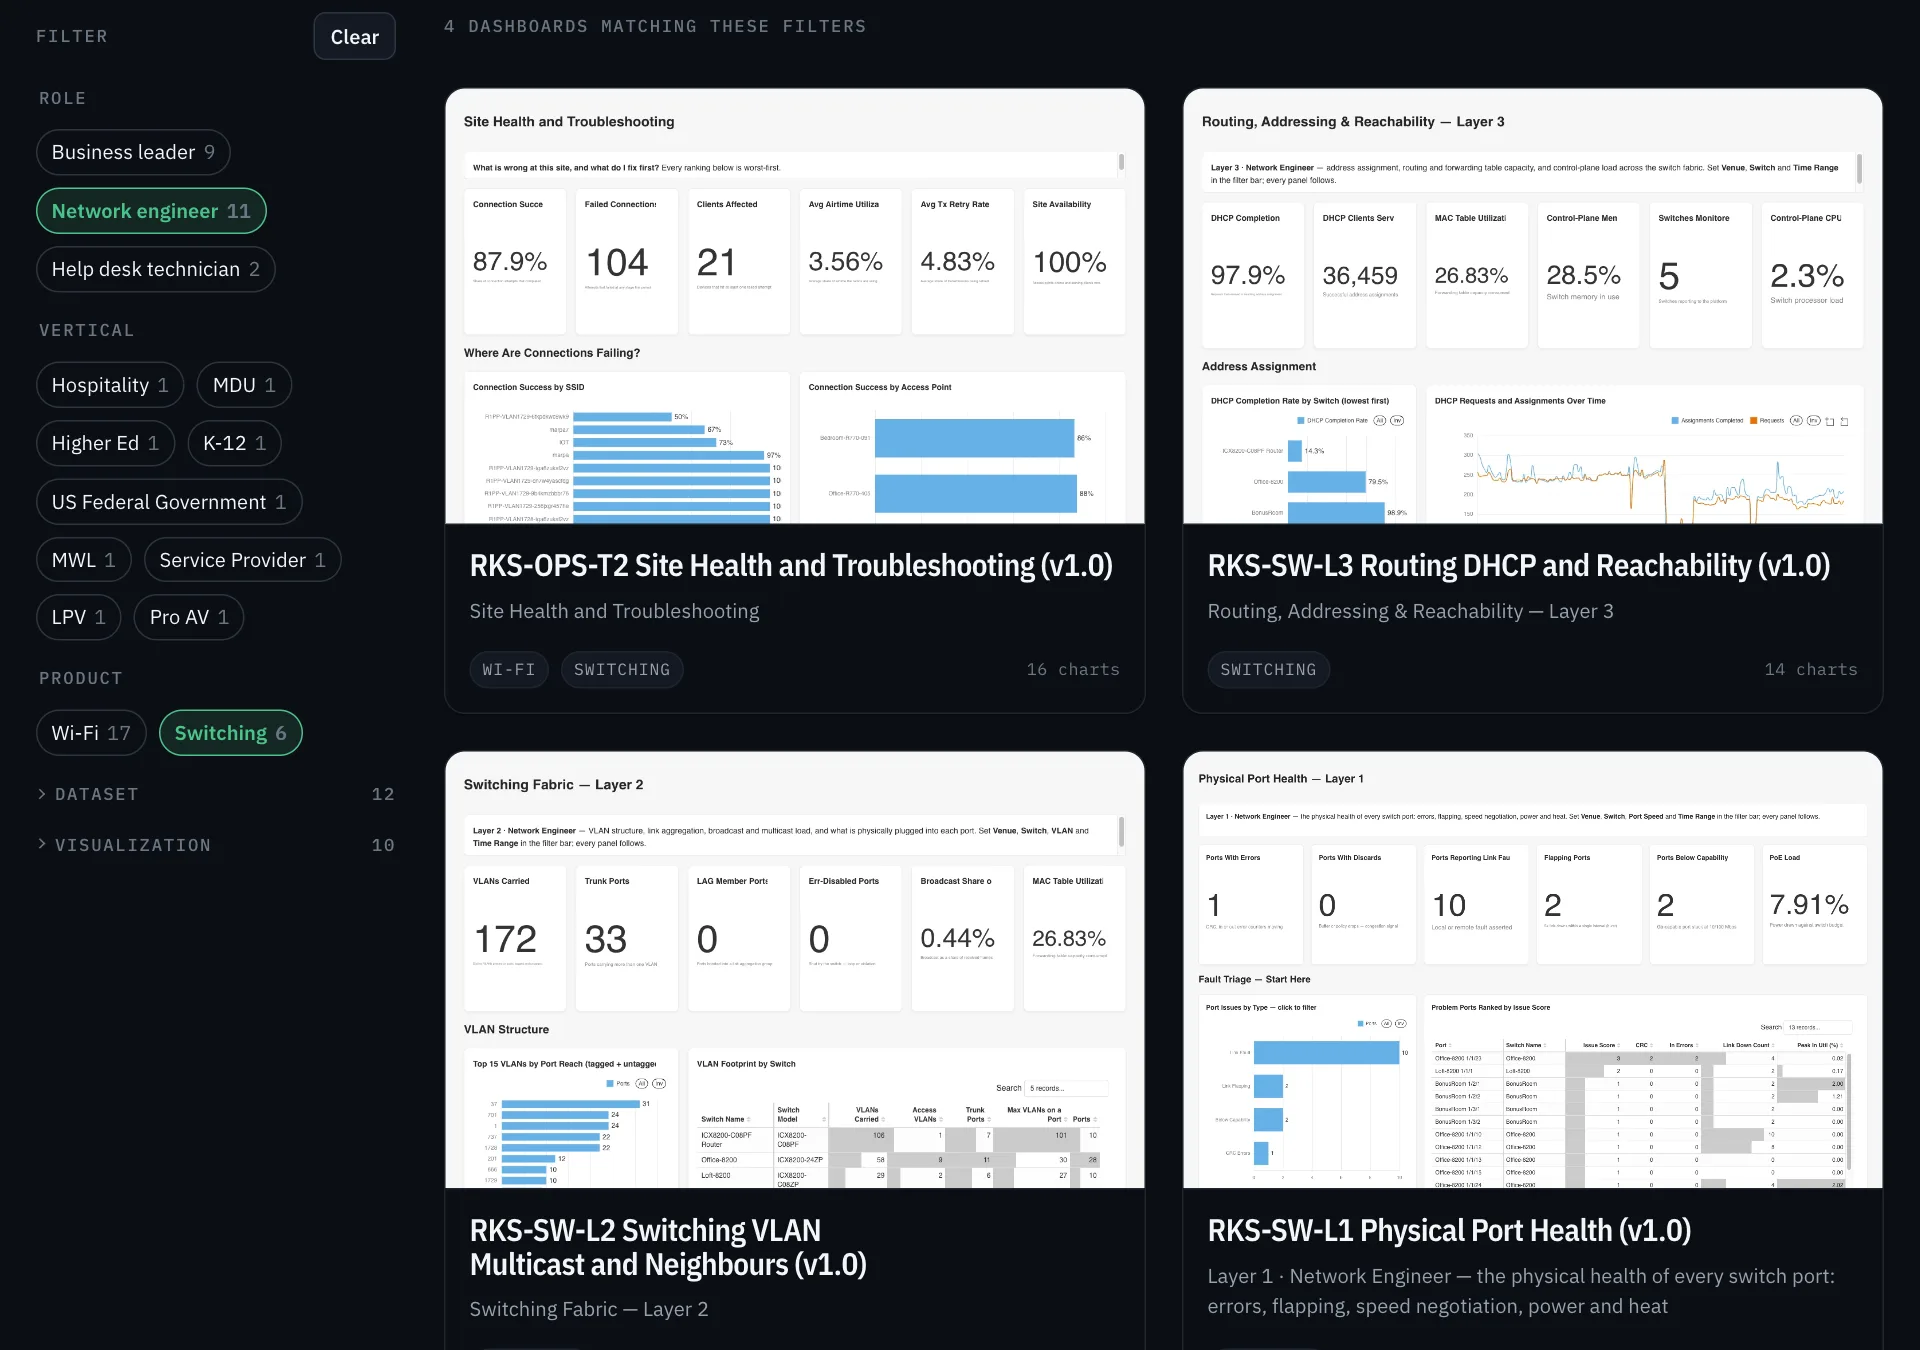
    Open the Filter rail and select Network engineer under Role and Switching under Product. The count line reads 4 dashboards matching these filters. Select multiple options within one category to widen results; add a second category to narrow them. Filtered URLs are shareable.

    Bookmark a filtered URL and send it to a colleague to show only what's relevant to them.

    The gallery filtered to Network engineer and Switching: the filter rail on the left and four matching dashboard cards, each with a preview, title and chart count.
  3. Step 3

    See the full dashboard

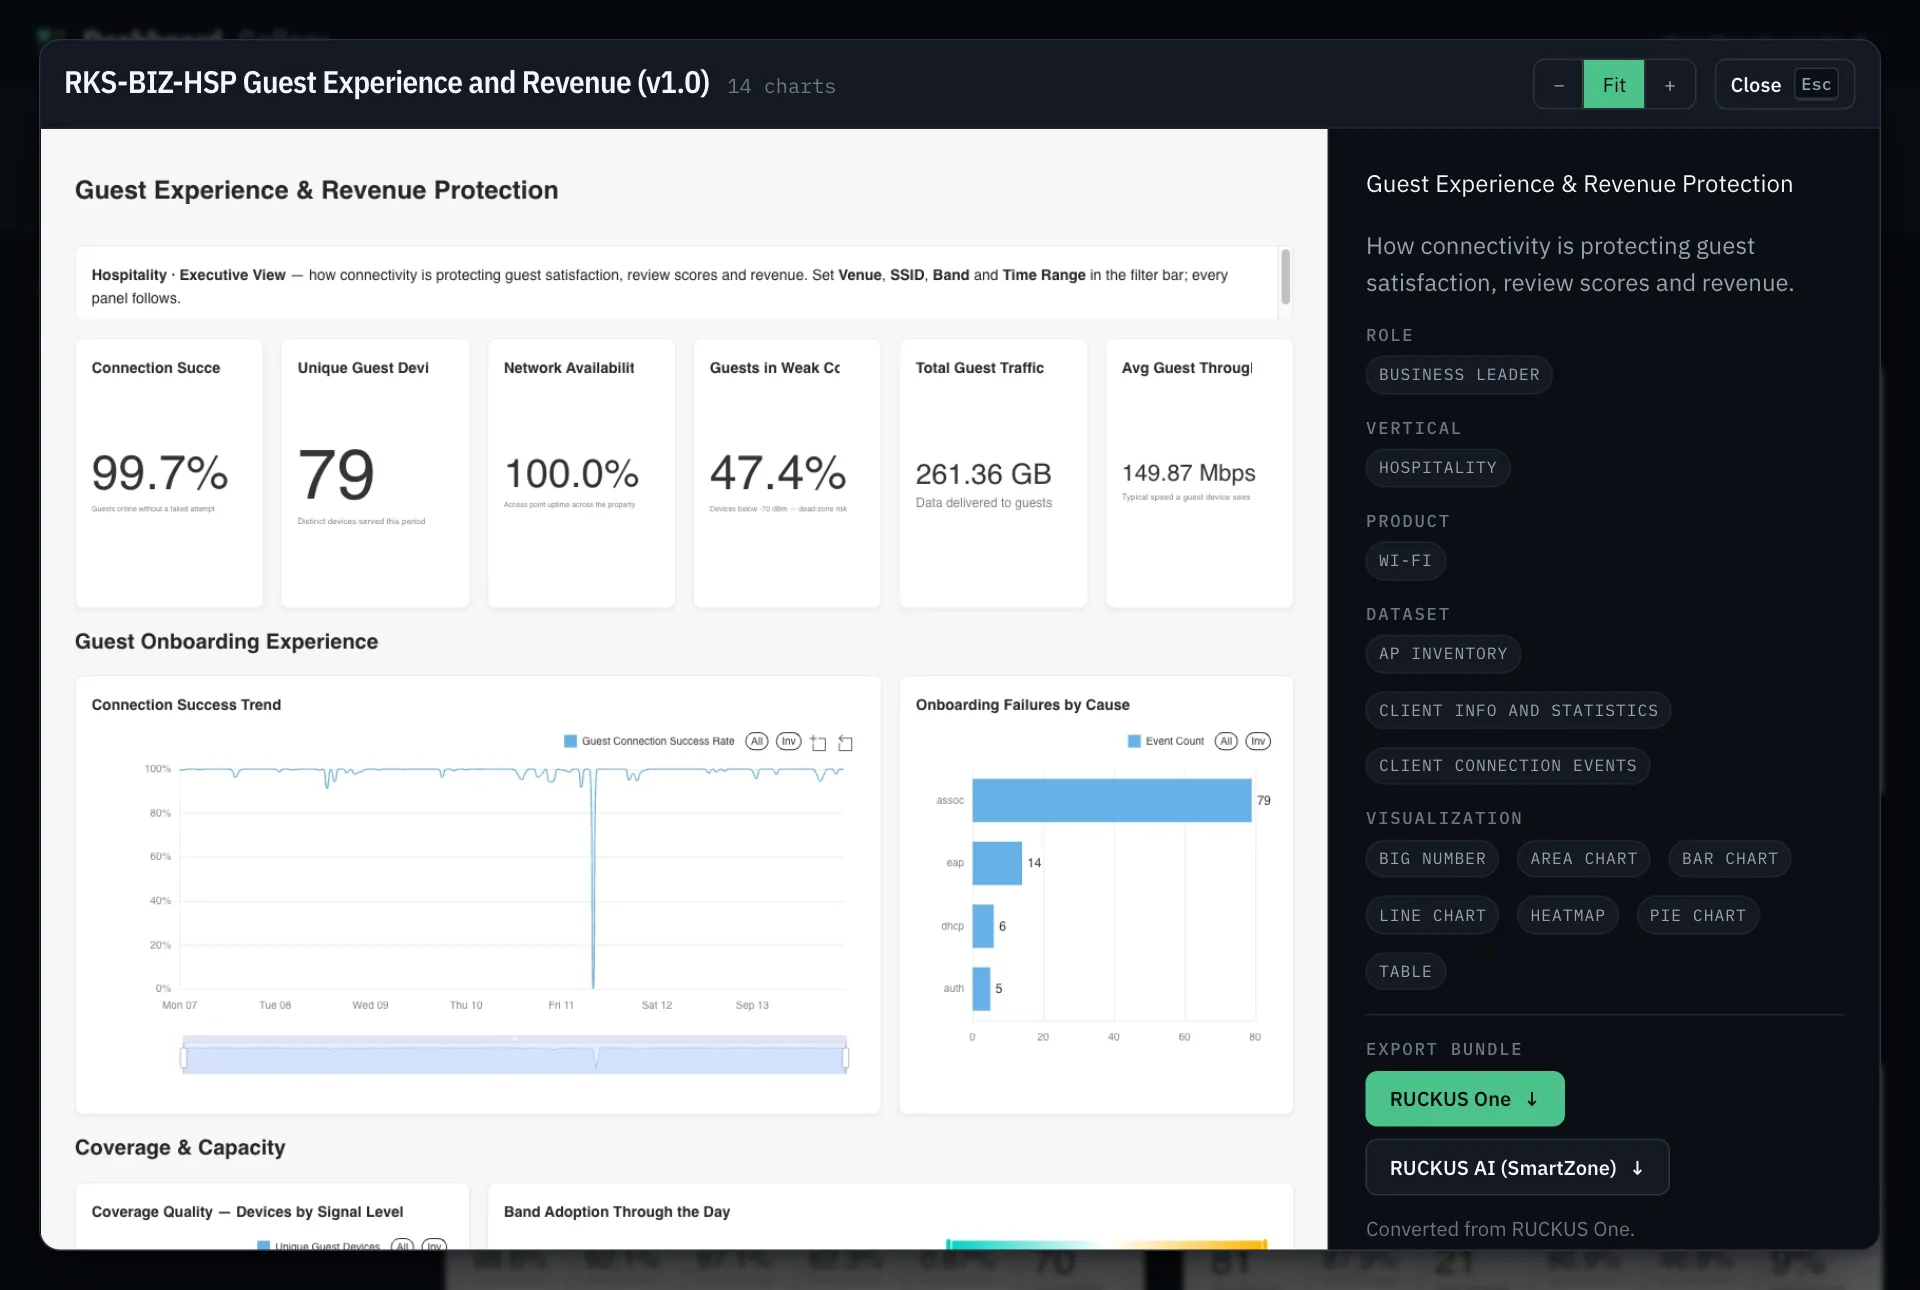
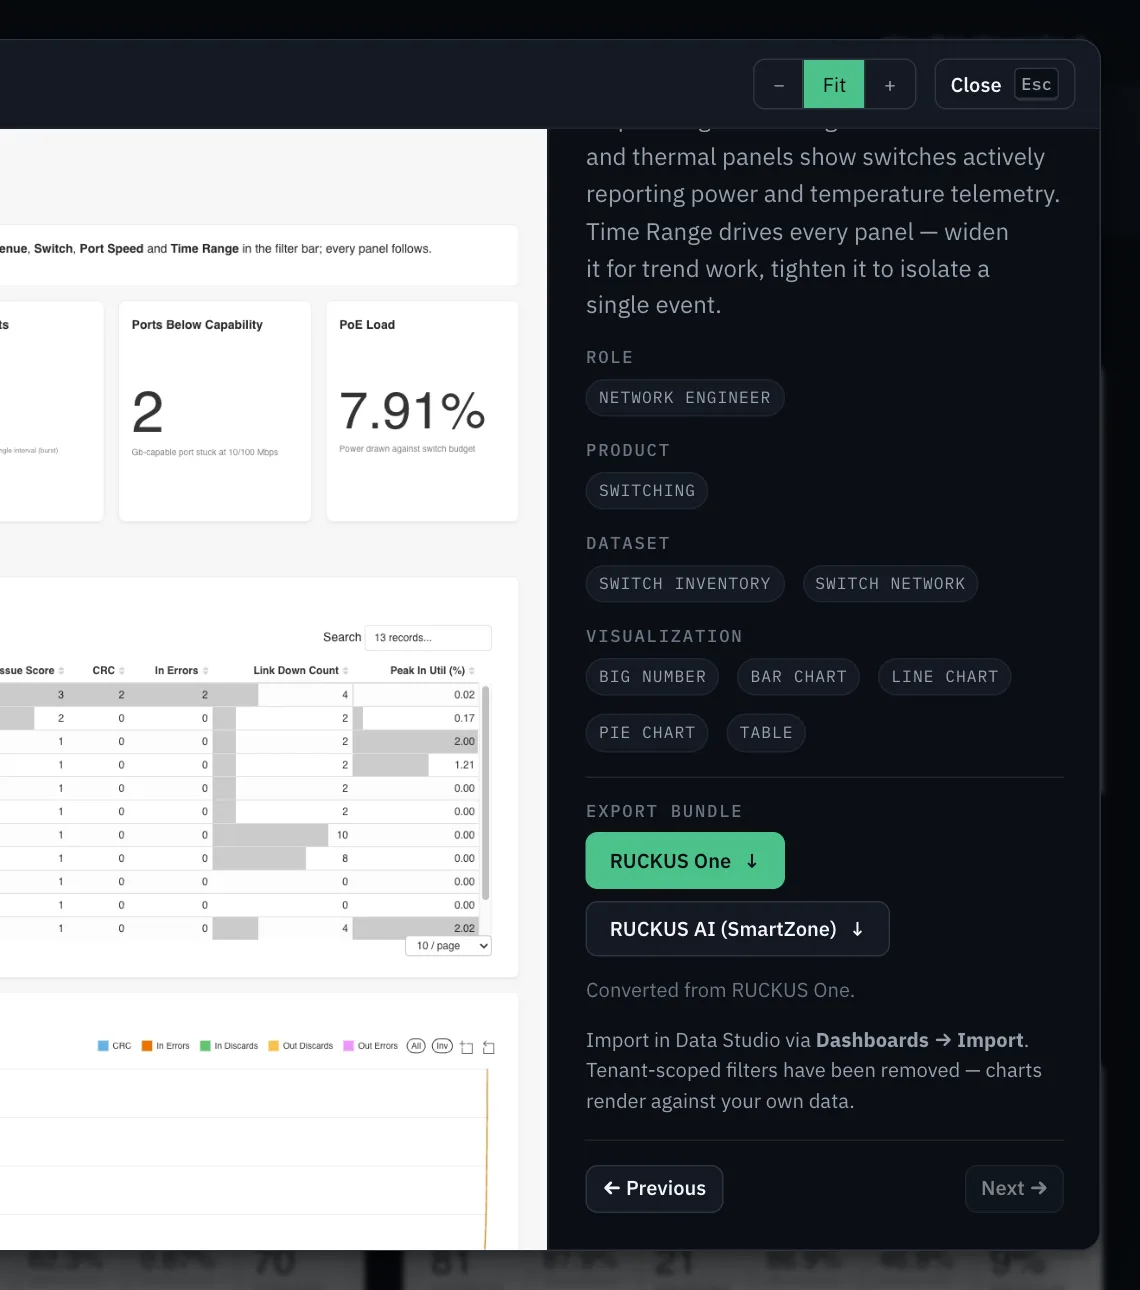
    The dialog opens RKS-BIZ-HSP Guest Experience and Revenue: the full screenshot fills the stage, labeled 14 charts. Use − Fit + to zoom and drag to pan. The side panel shows the summary and chips for Role, Vertical, Product, Dataset, and Visualization.

    Arrow keys step through dashboards without closing the dialog.

    An open dashboard, Guest Experience and Revenue: the full dashboard image with its tiles and charts, and a side panel with its description and Role, Vertical, Product, Dataset and Visualization tags.
  4. Step 4

    Download for your platform

    The Export bundle block offers RUCKUS One ↓ and RUCKUS AI (SmartZone) ↓ (the SmartZone file is converted from RUCKUS One). The import hint below both reads: Import in Data Studio via Dashboards → Import. Tenant-scoped filters have been removed — charts render against your own data.

    Each download gets fresh identifiers, so two tenants importing the same bundle won't collide.

    The Export bundle block of an open dashboard: a RUCKUS One download, a RUCKUS AI (SmartZone) download converted from RUCKUS One, and the instruction to import in Data Studio via Dashboards, Import.
  5. Step 5

    Import into Data Studio

    In RUCKUS One Data Studio, go to Dashboards → Import and choose the downloaded file. Charts bind to your tenant's own data.

    RUCKUS One Data Studio, Dashboards tab: the Import dashboards button at the right of the Bulk select and Dashboard buttons, with its tooltip showing.
    The Import dashboard dialog open over the dashboards list, with a Select file button and Cancel and Import buttons.
  6. Step 6

    Request what isn't there yet

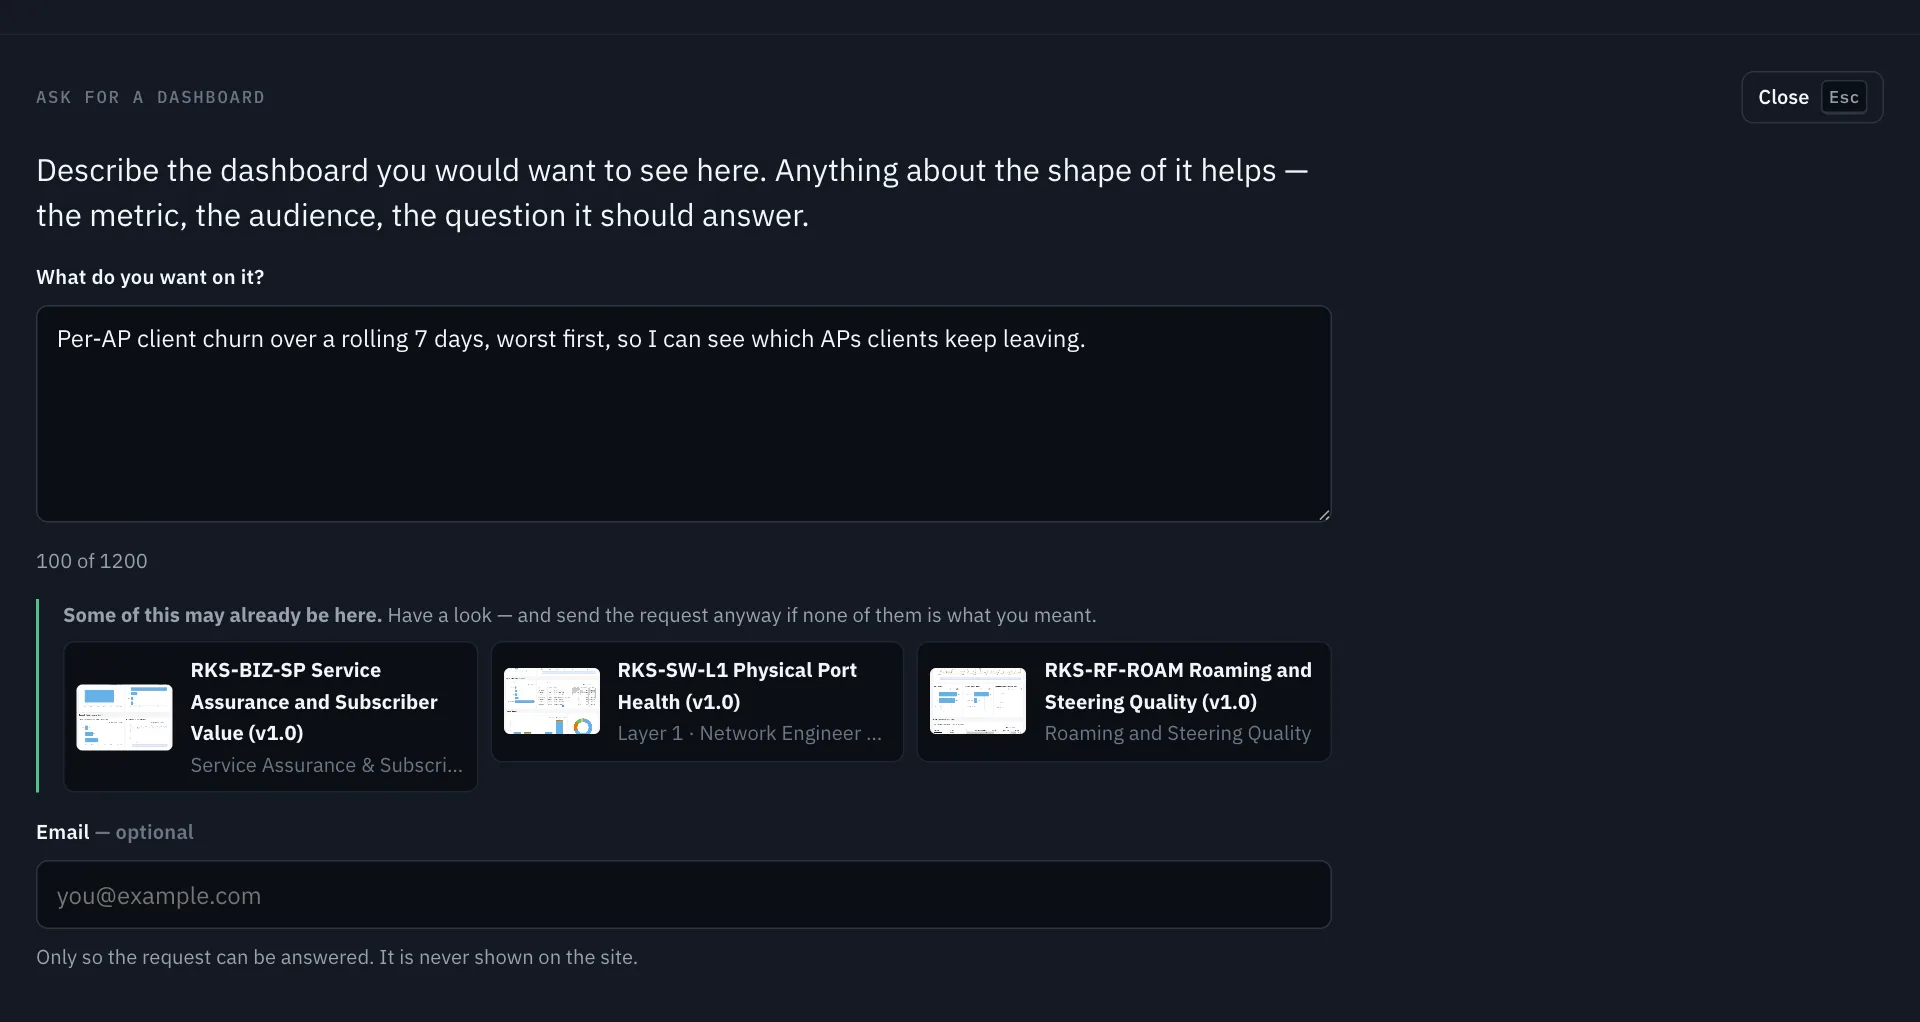
    Request this dashboard → seeds the panel with your question. As you type in Ask for a dashboard, up to three existing cards appear under “Some of this may already be here.” Check them, then send anyway if none fits. Add your email if you want to hear when it's published.

    The email field is optional; skip it and watch the gallery for new additions instead.

    The Ask for a dashboard panel: a typed description, three existing dashboards the gallery suggests might already cover it, and an optional email field.
  7. Step 7

    Convert between platforms

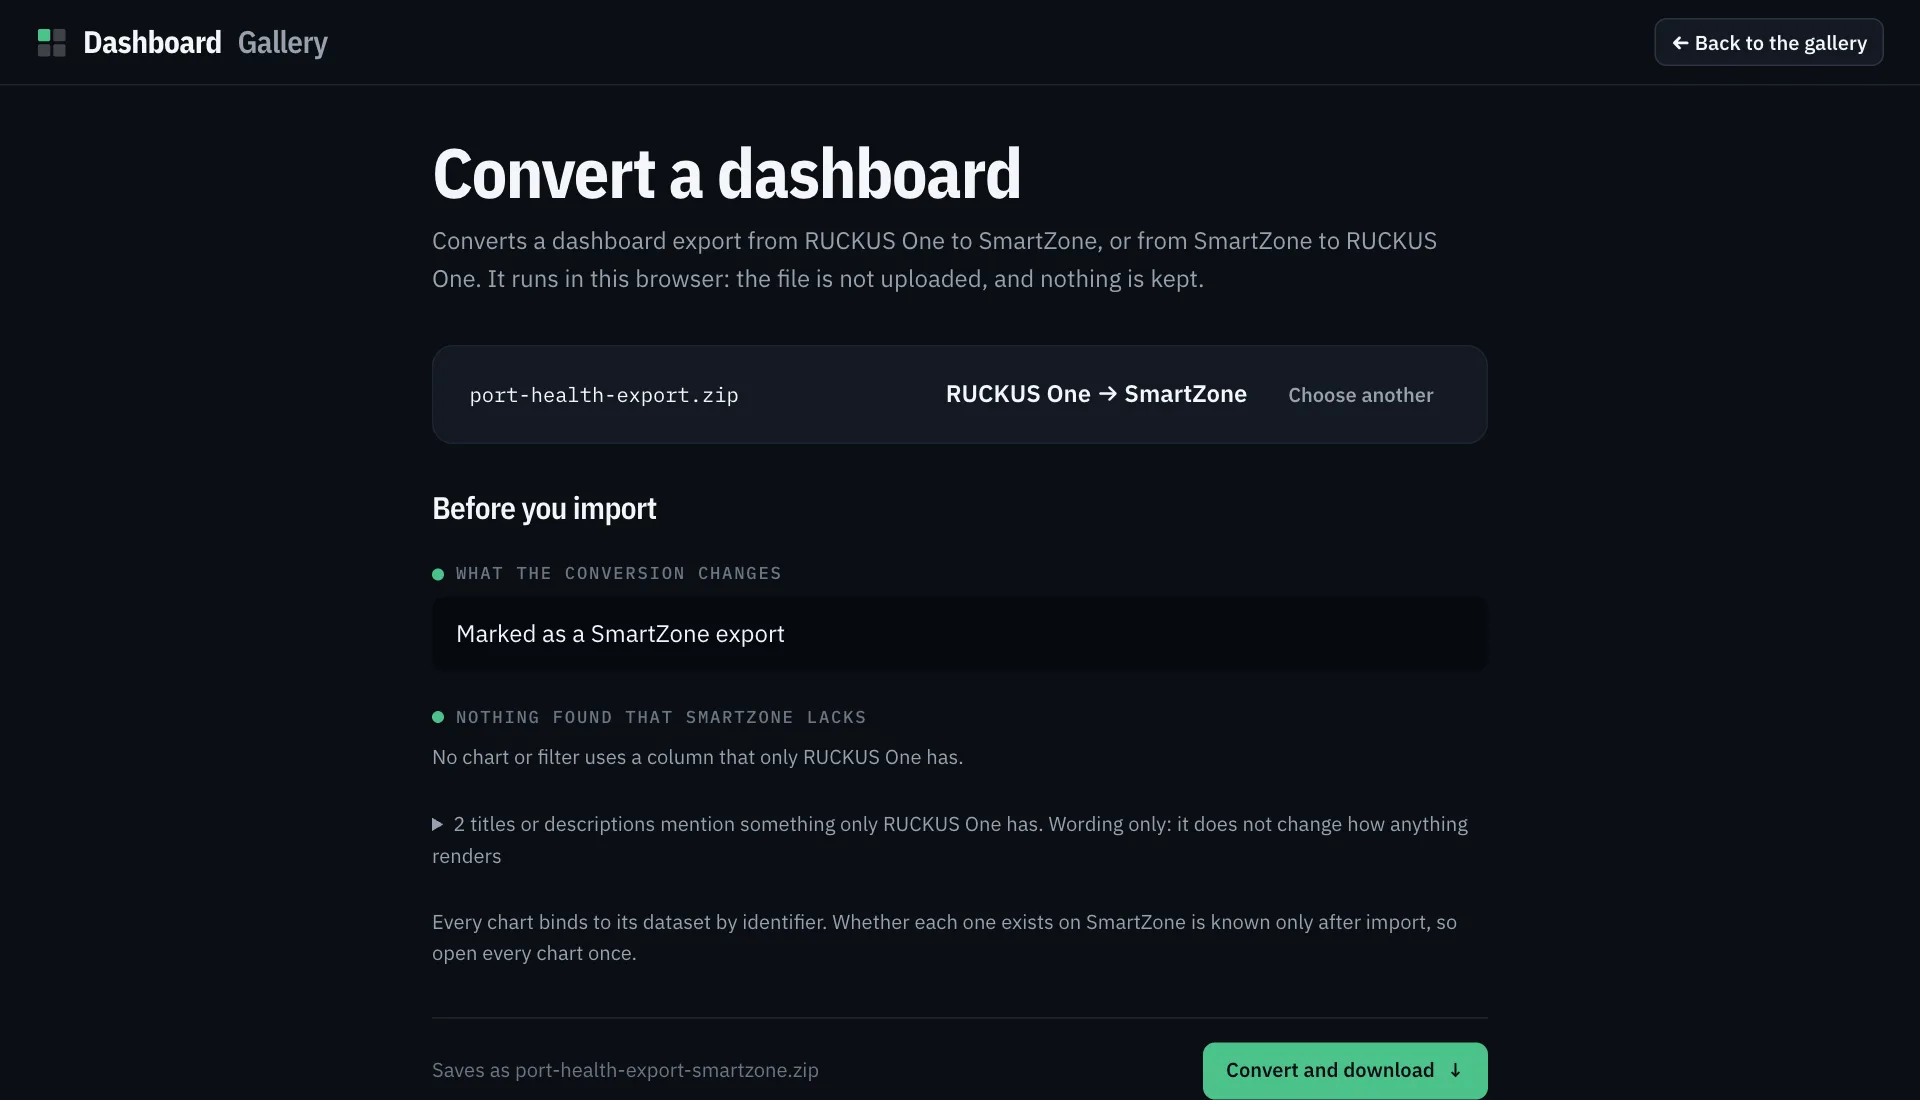
    Drop a RUCKUS One export on Convert a dashboard. The direction is read from the file — here, RUCKUS One → SmartZone — and a Before you import report lists every change and anything the target platform may lack. The file never leaves your browser. Click Convert and download ↓ to save.

    Works on any RUCKUS One or RUCKUS AI export, not just dashboards downloaded here.

    The Convert a dashboard page with an export loaded: RUCKUS One to SmartZone, what the conversion changes, and a check that no chart uses a column SmartZone lacks.

Screenshots are of the live gallery and, in step 5, RUCKUS One.

How a dashboard gets into the gallery safely

Before anything is public, two things happen: I redact the screenshot and I scrub the bundle. Both use one shared rule set, so the image and the download cannot disagree about what is sensitive.

How a dashboard is published Two tracks. The screenshot: OCR in my browser proposes boxes, I review them, the browser flattens opaque bars into a new image. The bundle: identity fields removed and site filters cleared, remaining values swapped for documentation stand-ins, then audited and refused if anything still matches. The originals stay in private storage; only the redacted image and scrubbed bundle reach the public gallery, and each download gets fresh identifiers. PRIVATE PUBLIC Screenshot original, kept private Export bundle original, kept private OCR proposes boxes runs in my browser I review every box add, move, remove Flatten opaque bars a new image, not a blur Strip identity owners, tenant, site filters Swap in stand-ins documentation ranges Audit, or refuse re-checked after writing Redacted image on the gallery Clean bundle new IDs each download one shared rule set for what counts as sensitive

The image

  1. Capture with real data I take a full screenshot of the dashboard as it looks with real data in it — addresses, hostnames, identifiers, and application names that should never reach a public URL.
  2. OCR in my browser An OCR engine running in my browser proposes selection boxes over addresses, hostnames, email addresses, serial numbers, identifiers, and application names. No outside OCR service receives the image.
  3. I review every box I approve each proposed box, add any the engine missed, and remove false positives. Only after I am satisfied does the next step run.
  4. Flatten and gate The browser flattens opaque bars into a new image — not a blur, not an overlay. Publishing requires at least one box or an explicit recorded decision that nothing needed redacting.

The bundle

  1. Remove identity fields At upload, identity and ownership fields are stripped automatically — anything that identifies the source tenant or its users.
  2. Clear tenant filters Filters pinned to a specific site, venue, or network are cleared, so charts show the importer's own data rather than mine.
  3. Replace sensitive values Addresses and names that remain are swapped for documentation-range stand-ins — the ranges reserved for examples — so an audit can tell a clean replacement from a missed one.
  4. Audit and refuse The archive is audited again after writing. If anything still matches, the publish is refused. Every download also gets fresh identifiers so imports across tenants never collide.

The unredacted screenshot and the original bundle are stored in private storage; no public route can address either. The gallery serves only the redacted image and the scrubbed bundle.

Built for the people who run these networks

Network engineer

Find the RF, switching, or operations dashboard you need for a change window or post-incident review. Download and import in minutes.

Business leader

See what your Wi-Fi delivers for guest experience, revenue, or utilization — without waiting for your network team to build something from scratch.

Help desk technician

Pull up a connectivity or client experience view during a support call without waiting for a custom build.

What is stored and what isn't

No cookies, no accounts, no browser storage on any public page. Here is exactly what is and isn't kept.

Your search question

The question text, which dashboards were returned, and performance counters are logged — no IP address, no session ID. Kept 180 days, then deleted by a daily job.

A dashboard request

Your description (up to 1,200 characters) and an optional email address. No IP is recorded. Kept until I delete it; there is no automatic retention clock.

Redaction and scrubbing

Every screenshot is reviewed before it is public; every bundle is scrubbed and audited. The gallery refuses a publish that still contains a matching pattern.

No account required

No sign-in, no cookies, no browser storage on any public page. The only third-party script is Cloudflare Turnstile, loaded only when you open the request form.

How it's built

I built Dashboard Gallery as a single Cloudflare Worker — API and React front end in one deployable.

The search

When a visitor types a question, the Worker runs two retrieval passes in parallel: a keyword index and a vector index. Their rankings are fused before the model sees any result. The keyword side uses SQLite FTS5 with weights tuned per field — title scores highest, then summary, description, facet labels, and chart titles. The vector side uses 768-dimensional embeddings; both the visitor's own sentence and the model's rewritten search terms are embedded separately and merged into the final ranking.

Chart titles from each bundle are indexed, so a question about a specific metric can surface by chart name — but the model is shown at most one matched chart title, never the full list. Cards in the UI come only from rows the search actually returned; the model cannot produce a card for a dashboard that isn't in the index. Model choice came from a benchmark I ran on the gallery's own question set: the primary scores higher on precision; a fallback takes over when the day's compute budget approaches its ceiling. When the ceiling is reached, the search degrades gracefully to a clean message and points the visitor to the filters.

The converter

The /convert page converts a dashboard export between RUCKUS One and RUCKUS AI (SmartZone). The conversion runs entirely in the browser — the file is read locally and never uploaded. Direction is read from the file, not picked by the user. A “Before you import” report shows exactly what will change and flags anything the target platform is likely to lack; the check never blocks the download.

The converter exists because I develop dashboards on RUCKUS One and needed a reliable conversion path for sites running SmartZone. I validated the output by importing a converted bundle on a real RUCKUS AI instance and confirmed the charts and filters worked. The page is also available as a standalone tool for anyone who needs to convert their own exports.

Common questions

No. The gallery, search, downloads, and converter are all free. No account, no payment, no trial period — browse, search, and download.
Where your tenant has the underlying data (AP inventory, client sessions, switch telemetry), the charts populate. Tenant-scoped filters are cleared so nothing is pre-filtered to someone else's network.
Use Request this dashboard → under any search answer, or open Ask for a dashboard directly. Describe what you want; add an email if you'd like to hear when it's published. Requests go into a queue I review and build from.
It runs keyword and vector retrieval in parallel, fuses the rankings, then uses a language model to explain the best fit. Cards appear only for dashboards the search actually found — the model cannot suggest one that isn't in the gallery.
Every bundle is scrubbed at upload: identity fields are removed, tenant-specific filters are cleared, and remaining addresses or names are replaced with documentation-range stand-ins. The archive is audited after writing and refused if anything still matches.
Yes. Drop any RUCKUS One or RUCKUS AI export on the Convert page. The conversion runs in your browser — nothing is uploaded. A report shows what changed before you save the file.

The dashboard you need might already be there.

21 RUCKUS One and RUCKUS AI dashboards, free to search and download. Describe what you need — the gallery does the rest.

Open Dashboard Gallery ↗

Dashboard Gallery is an independent product of NeuralConfig LLC. It is not made, endorsed or supported by RUCKUS Networks. RUCKUS and RUCKUS One are trademarks of their respective owners.